Question 1.
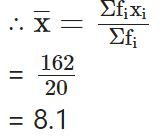
A survey was conducted by a group of students as a part of their environment awareness programme, in which they collected the following data regarding the number of plants in 20 houses in a locality. Find the mean number of plants per house.

Answer:
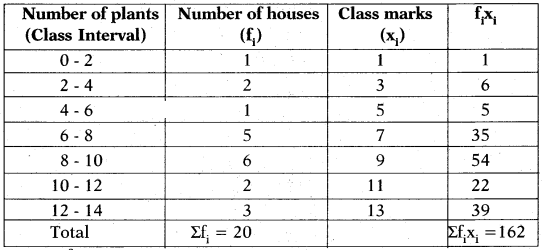
Since fiand xiare of small values we use direct method.
Question 2.
Consider the following distribution of daily wages of 50 workers of a factory.

Find the mean daily wages of the workers of the factory by using an appropriate method.
Answer:
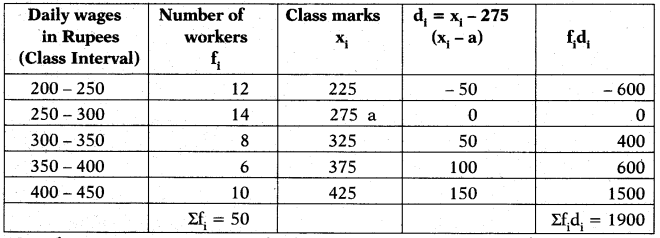
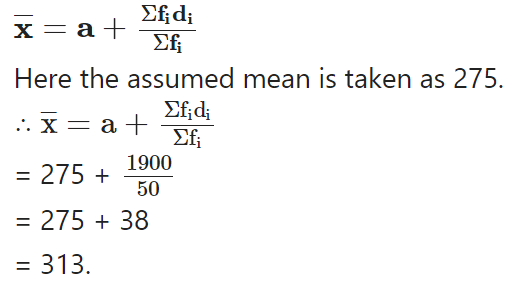
Here the xiare of large numerical values.
So we use deviation method then,
Question 3.
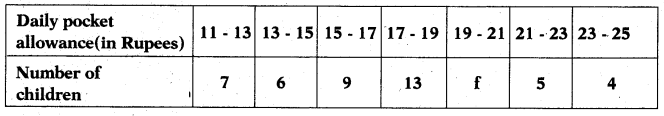
The following distribution shows the daily pocket allowance of children of a locality. The mean pocket allowance is Rs. 18. Find the missing frequency f.
Answer:

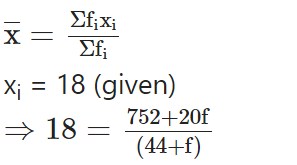
18 (44 + f) = 752 + 20 f
⇒ 20f- 18f= 792-752
⇒ 2f = 40
∴ f =40/20= 20.
Question 4.
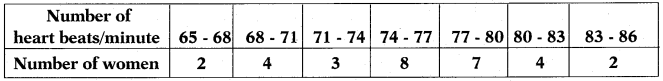
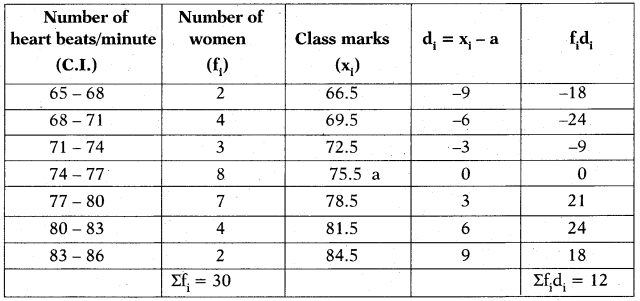
Thirty women were examined in a hospital by a doctor and their of heart beats per minute were recorded and summarised as shown. Find the mean heart beats per minute for these women, choosing a suitable method.
Answer:
Question 5.
In a retail market, fruit vendors were selling oranges kept in packing baskets. These baskets contained varying number of oranges. The following was the distribution of oranges.

Find the mean number of oranges kept in each basket. Which method of finding the mean did you choose?
Answer:

Here we use step deviation method where a = 135, h = 5,a multiple of all di
Question 6.
The table below shows the daily expenditure on food of 25 households in a locality.

Find the mean daily expenditure on food by a suitable method.
Answer:
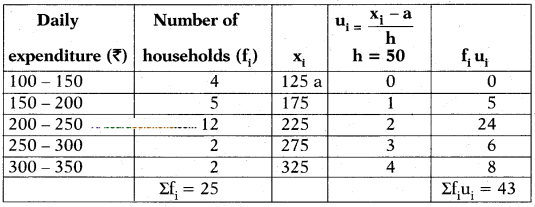
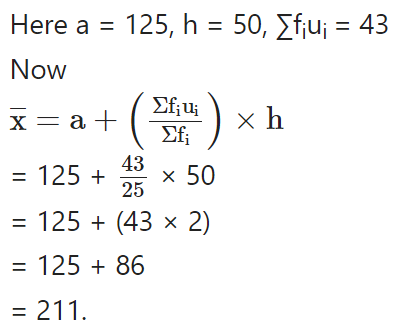
NOTE: If we consider first value as “a” then we dont get negative values inui,fiuicolumns. Then it becomes easy for calculation.
Question 7.
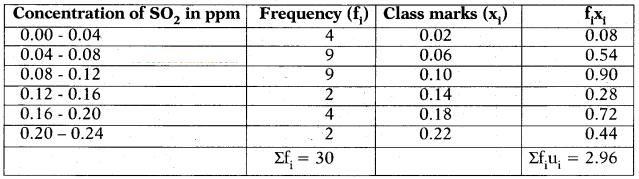
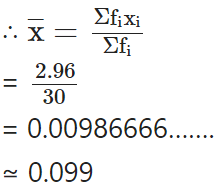
To find out the concentration of SO2in the air (in parts per million, i.e., ppm), the data was collected for 30 localities in a certain city and is presented below:
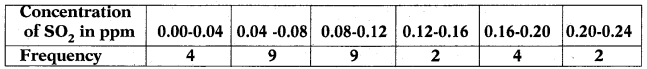
Find the mean concentration of SO2in the air.
Answer:
Question 8.
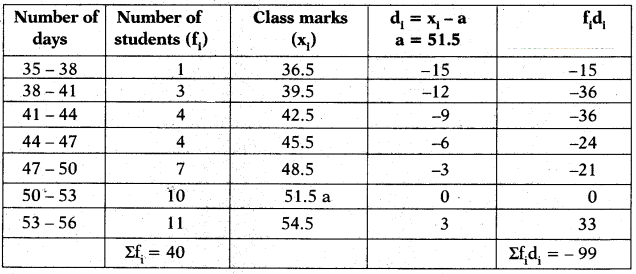
A class teacher has the following attendance record of 40 students of a class for the whole term. Find the mean number of days a student was present out of 56 days in the term.
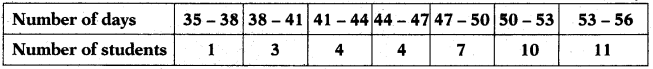
Answer:
Question 9.
The following table gives the literacy rate (in percentage) of 35 cities. Find the mean literacy rate.
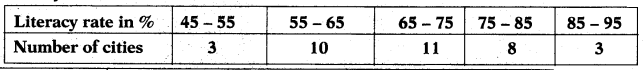
Answer:
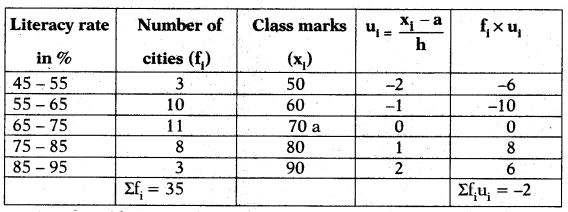
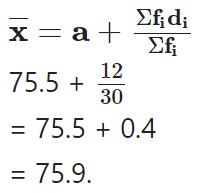
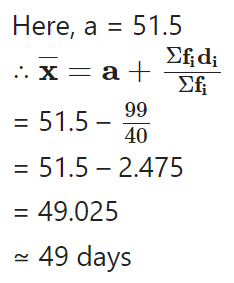
= 70 - 0.57142
= 69.4285
≃ 69.43%
Question 1.
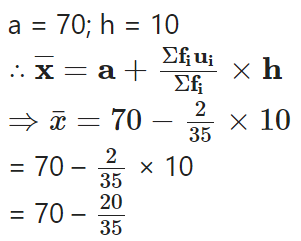
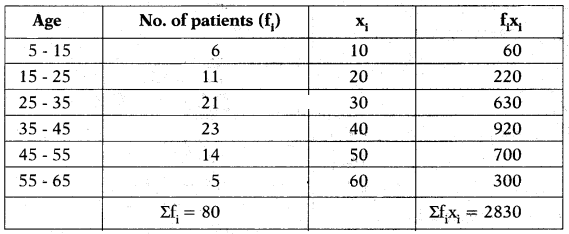
The following table shows the ages of the patients admitted in a hospital during a year:
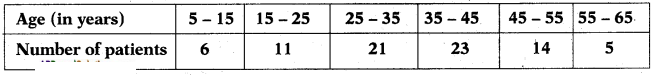
Find the mode and the mean of the data given above. Compare and interpret the two measures of central tendency.
Answer:
Maximum number of patients joined in the age group 35 - 45.
∴ Modal class is 35 – 45.
Lower limit of the modal class ‘l’ = 35
Class size h = 10
Frequency of modal class, f1= 23
Frequency of the class preceding the modal class f0= 21
Frequency of the class succeeding the modal class f2= 14
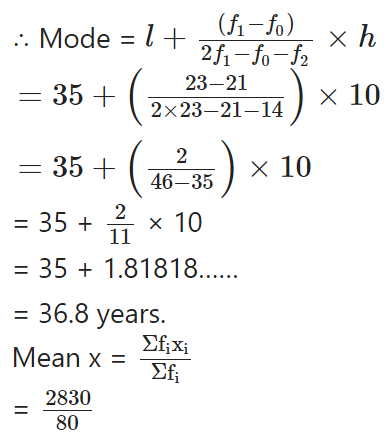
= 35.37 years.
Interpretation: Mode age is 36.8 years, Mean age = 35.37 years.
Maximum number of patients admitted in the hospital are of the age 36.8 years, while on an average the age of patients admitted to the hospital is 35.37 years. Mode is less than the Mean.
Question 2.
The following data gives the information on the observed lifetimes (in hours) of 225 electrical components:
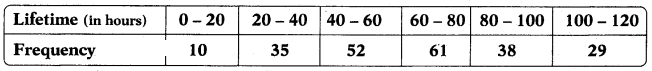
Determine the modal lifetimes of the components.
Answer:
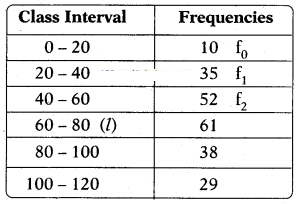
Since the maximum frequency 61 is in the class 60 - 80, this is the required modal class.
Modal class frequency, f1= 61.
Frequency of the class preceding the modal class f0= 52
Frequency of the class succeeding the modal class f2= 38
Lower boundary of the modal class, l = 60
Height of the class, h = 20
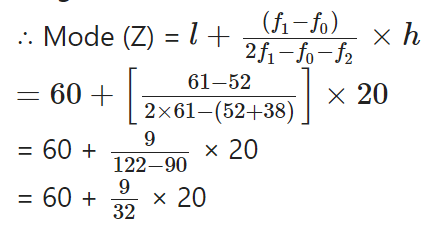
= 60 + 5.625
= 65.625 hours.
Question 3.
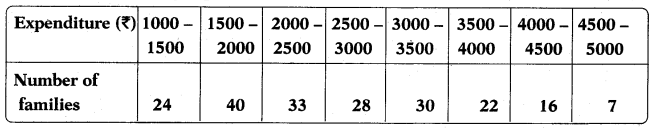
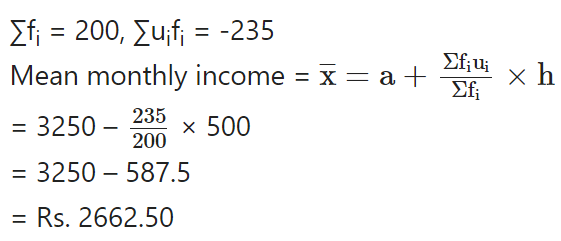
The following data gives the distribution of total monthly household expenditure of 200 families of a village. Find the modal monthly expenditure of the families. Also, find the mean monthly expenditure:
Answer:
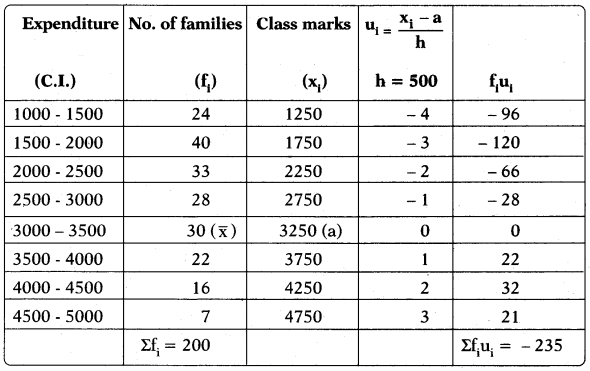
Since the maximum families 40 lies in the class 1500 - 2000, this is the required modal class.
Lower boundary of the modal class (l) = 1500
Frequency of the modal class (f1) = 40
Frequency of the class preceding the modal class f0= 24
Frequency of the class succeeding the modal class f2= 33
Height of the class, h = 500
Hence, modal monthly income = Rs. 1847.83.
Assumed mean (a) = 3250
Question 4.
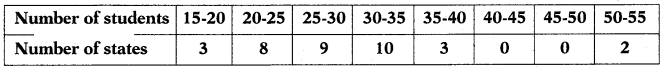
The following distribution gives the state-wise, teacher-student ratio in higher secondary schools of India. Find the mode and mean of this data. Interpret the two measures.
Answer:
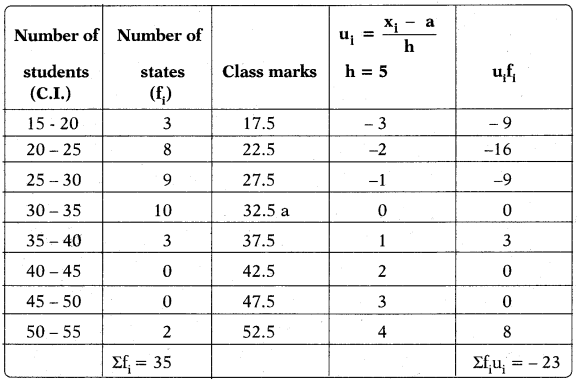
Since the maximum number of states ‘10’ lies in the class interval 30-35, this is the modal class.
Lower boundary of the modal class, l = 30
Frequency of the modal class, f1= 10
Frequency of the class preceding the modal class = f0= 9
Frequency of the class succeeding the modal class = f2= 3
Height of the class, h = 5
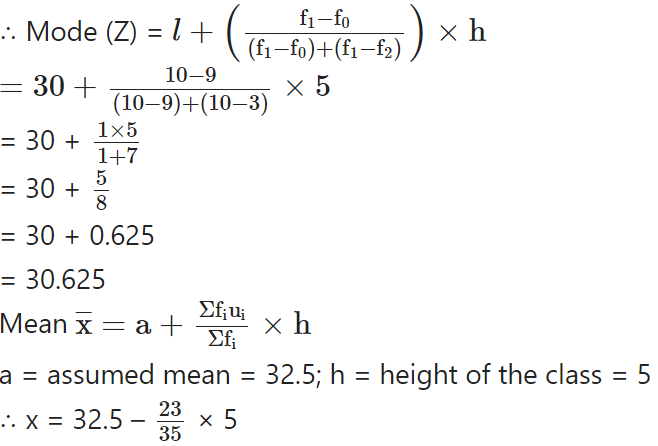
= 32.5 - 3.28
= 29.22
Mean = 30.625
Mode = 29.22
Mode states have a students - teacher ratio 29.22 and on an average this ratio is 30.625.
Question 5.
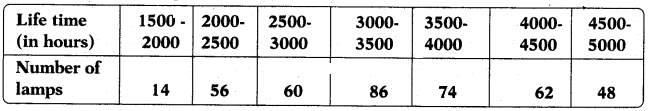
The given distribution shows the number of runs scored by some top batsmen of the world in one-day international cricket matches.
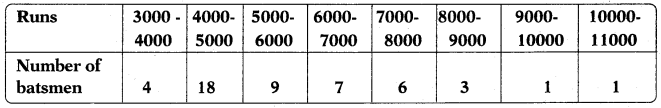
Find the mode of the data.
Answer:
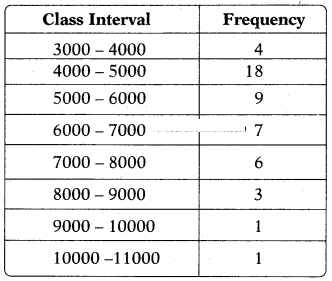
Maximum number of batsmen are in the class 4000 - 5000.
∴ Modal class is 4000 - 5000.
Lower boundary of the modal class ‘l’ = 4000
Frequency of the modal class, f1 = 18
Frequency of the class preceding the modal class, f0= 4
Frequency of the class succeeding the modal class, f2= 9
Height of the class, h = 1000
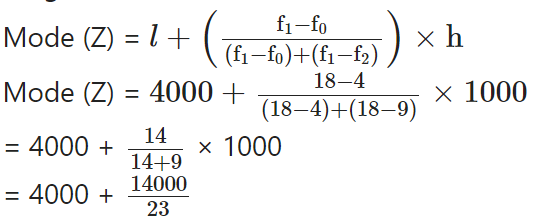
= 4000 + 608.695
= 4608.69
≃ 4608.7 runs
Question 6.
A student noted the number of cars passing through a spot on a road for 100 periods, each of 3 minutes, and summarised this in the table given below.
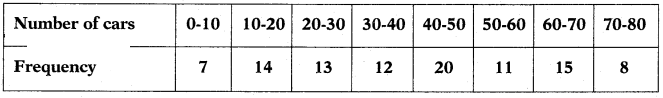
Find the mode of the data.
Answer:
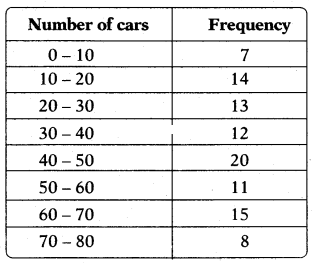
Since the maximum frequency is 20, the modal class is 40 - 50.
Lower boundary of the modal class ‘l’ = 40
Frequency of the modal class, f1= 20
Frequency of the class preceding the modal class, f0= 12
Frequency of the class succeeding the modal class, f2= 11
Height of the class, h = 10;
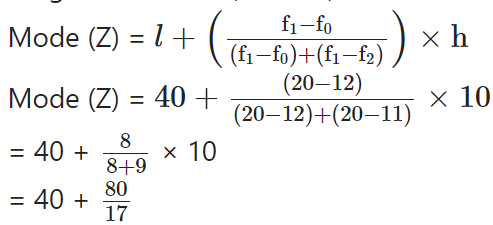
= 40 + 4.70588
= 44.705
≃ 44.7 cars
Question 1.
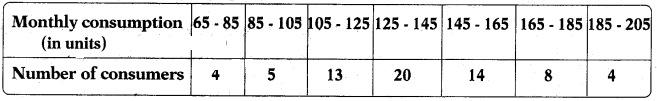
The following frequency distribution gives the monthly consumption of electricity of 68 consumers of a locality. Find the median, mean and mode of the data and compare them.
Answer:
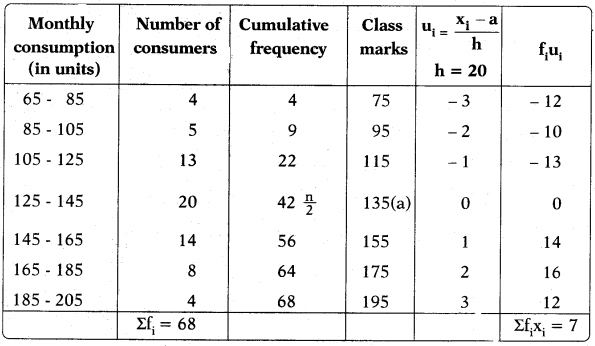
Sum of the frequencies = 68
&there4 n/2 = 68/2 = 34
Hence median class = 125 - 145
Lower boundary of the median class, l = 125
cf - cumulative frequency of the class preceding the median class = 22
f - frequency of the median class = 20
h = class size = 20
Median = l+[n/2?cf]/f × h
= 125 + [34?22]/20 × 20
&there4 Median = 125 + 12 = 137
Maximum number of consumers lie in the class 125 - 145
Modal class is 125 -145
l - lower limit of the modal class =125
f1- frequency of the modal class = 20
f0- frequency of the class preceding the modal class =13
f2- frequency of the class succeeding the modal class =14
h - size of the class = 20
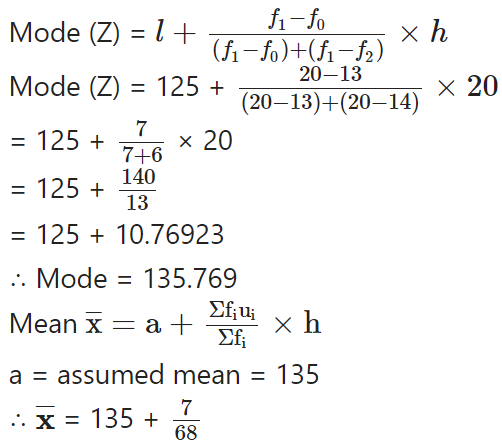
= 135 + 0.102941
≃ 135.1
Mean, Median and Mode are approximately same in this case.
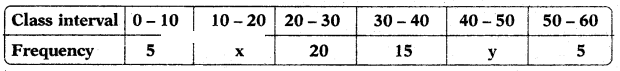
Question 2.
If the median of 60 observations, given below is 28.5, find the values of x and y.
Answer:
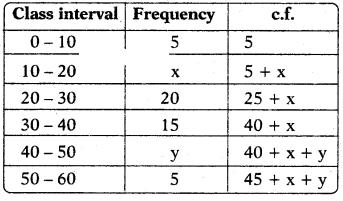
Median =l+[n2?cf]/f × h
It is given that ∑f = n = 60
So, 45 + x + y = 60
x + y = 60 - 45 = 15
x + y = 15 ….. (1)
The median is 28.5 which lies be-tween 20 and 30.
Median class = 20 - 30
Lower boundary of the median class ‘l’ = 20
N/2 = 60/2 = 30
cf - cumulative frequency = 5 + x
h = 10
Median = l+[n/2?cf]/f × h
⇒ 28.5 = 20 + 30?5?x/20 × 10
⇒ 28.5 = 20 + 25?x/2
25?x/2 = 28.5 - 20 = 8.5
25 - x = 2 × 8.5
x = 25- 17 = 8
also from (1); x + y = 15
8 + y = 15
y = 7
&there4 x = 8; y = 7.
Question 3.
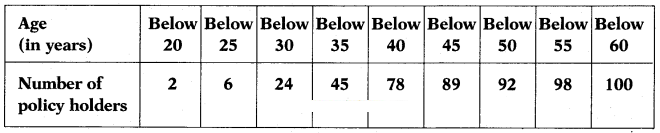
A life insurance agent found the following data about distribution of ages of 100 policy holders. Calculate the median age. [Policies are given only to persons having age 18 years onwards but less than 60 years.
Answer:
The given distribution being of the less than type, 25, 30, 35, give the upper limits of corresponding class intervals. So the classes should be 20 - 25, 25 - 30, 30 - 35, ………. 55 - 60.
Observe that from the given distribution 2 persons with age less than 20.
i.e., frequency of the class below 20 is 2.
Now there are 6 persons with age less than 25 and 2 persons with age less than 20.
∴ The number of persons with age in the interval 20 - 25 is 6 - 2 = 4.
Similarly, the frequencies can be calculated as shown in table.
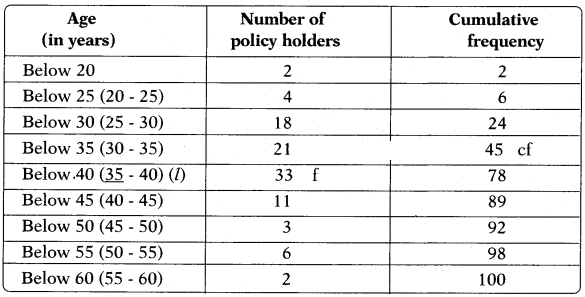
Number of observations = 100
n = 100
n/2 = 100/2 = 50, which lies in the class 35-40
&there4 35 - 40 is the median class and lower boundary l = 35
cf = 45;
h = 5;
f = 33
Median = l+[n/2?cf]/f × h
= 35 + 50?45/33 × 5
= 35 + 5/33 × 5
= 35 + 0.7575
= 35.7575
&there4 Median ≃ 35.76
Question 4.
The lengths of 40 leaves of a plant are measured correct to the nearest millimetre, and the data obtained is represented in the following table:
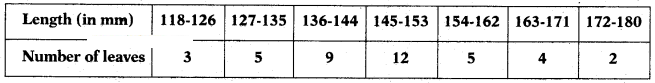
Find the median length of the leaves. (Hint: The data needs to be converted to continuous classes for finding the median, since the formula assumes continuous classes. The classes then change to 117.5 – 126.5, 126.5 – 135.5,…, 171.5 – 180.5.)
Answer:
Since the formula, Median = l+[n/2?cf]/f × h assumes continuous classes assumes continuous class, the data needs to be converted to continuous classes.
The classes then changes to 117.5 - 126.5; 126.5 - 133.5, .. 171.5 - 180.5.
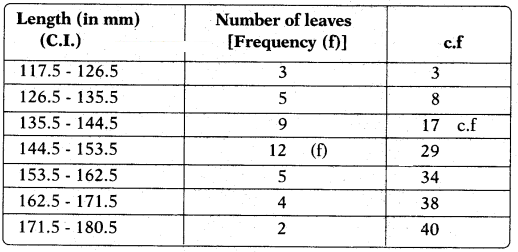
∑fi = n = 40
n/2 = 40/2 = 20
n/2 th observation lie in the class 144.5- 153.5
&there4 Median class = 144.5 - 153.5
Lower boundary, l = 144.5
Frequency of the median class, f = 12
c.f. = 17
h = 9
&there4 Median = l+[n/2?cf]/f × h
= 144.5 + 20?17/12 × 9
= 144.5 + 3/12 × 9
= 144.5 + 9/4
= 144.5 + 2.25
&there4 Median length = 146.75 mm.
Question 5.
The following table gives the distribution of the life-time of 400 neon lamps.
Find the median life-time of a lamp.
Answer:
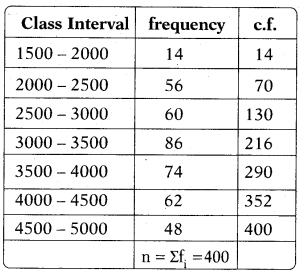
Total observations are n = 400
n2th observation i.e 4002 = 200
200 lies in the class 3000 - 3500
&there4 Median class = 3000 - 3500
Lower boundary l = 3000
frequency of the median class f = 86
c.f = 130
Class size, h = 500
Median = l+[n/2?cf]/f × h
= 3000 + 200?130/86 × 500
= 3000 + 70/86 × 500
= 3000 + 406.977
= 3406.98
&there4 Median life ≃ 3406.98 hours
Question 6.
100 surnames were randomly picked up from a local telephone directory and the frequency distribution of the number of letters in the English alphabet in the surnames was obtained as follows.
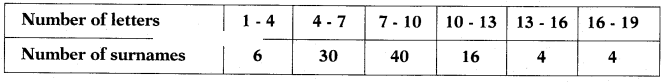
Determine the median number of letters in the surnames. Find the mean number of letters in the surnames ? Also, find the modal size of the surnames.
Answer:
Number of letters in the surnames.
Also find the modal size of the surnames.
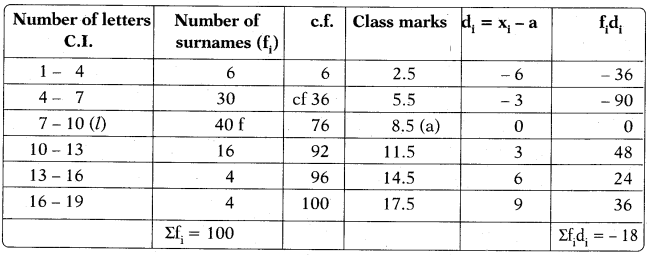
Total observations are n = 100
n/2 = 100/2 = 50
50 lies in the class 7 - 10
&there4 Median class = 7 - 10
l - lower boundary = 7
f - frequency of the median class = 40
cf = 36
Class size h = 3
Median:
Median = l+[n/2?cf]/f × h
= 7 + 50?36/40 × 3
= 7 + 14/40 × 3
= 7 + 42/40
= 7 + 1.05
= 8.05
&there4 Median = 8.05.

= 7 + 3034
= 7 + 0.882
= 7.882
Median = 8.0.5; Mean = 8.32; Modal size = 7.88.
Question 7.
The distribution below gives the weights of 30 students of a class. Find the median weight of the students.

Answer:
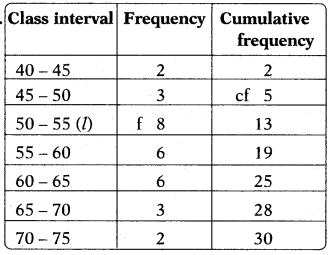
Number of observations (n) = ∑fi
n/2 = 30/2 = 15
15 lies in the class 50 - 55
&there4 Median class = 50-55
l - lower boundary of the median class = 55
f - frequency of the median class = 8
c.f = 5
Class size h = 6
Median = l+[n/2?cf]/f × h
= 50 + 15?5/8 × 6
= 50 + 7.5
= 57.5
= 50 + 7.5 = 57.5
&there4 Median weight = 57.5 kg.
Question 1.
The following distribution gives the daily income of 50 workers of a factory.
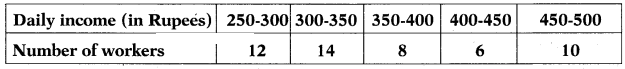
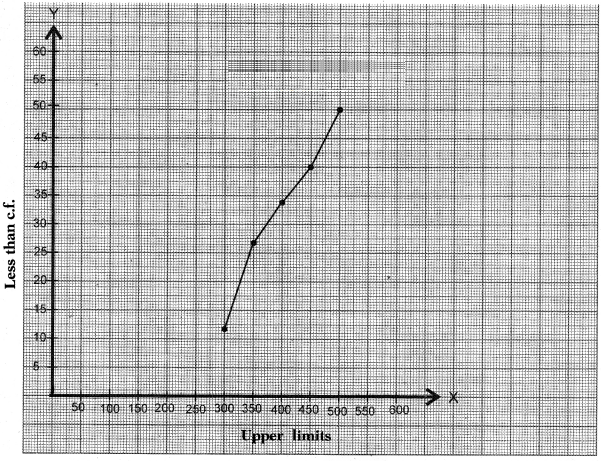
Convert the distribution above to a less than type cumulative frequency distribution, and draw its ogive.
Answer:
Since the curve is a less than type graph the data changes to
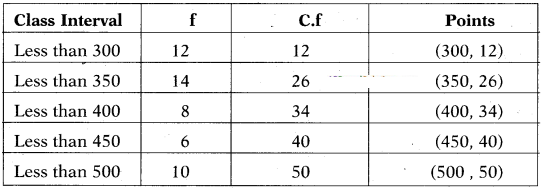
X - axis - upper limits 1 cm = 50 units.
Y - axis - less than c.f. 1 cm = 5 units.
Question 2.
During the medical check-up of 35 students of a class, their weights were recorded as follows:
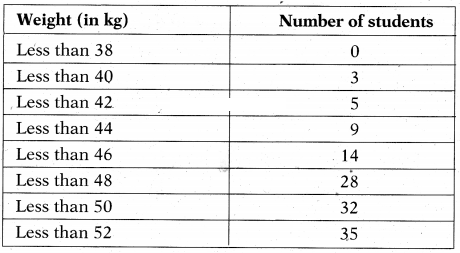
Draw a less than type ogive for the given data. Hence obtain the median weight from the graph and verify the result by using the formula.
Answer:
Given: Upper limits of the classes and less than cumulative frequencies. Therefore required points are (38, 0), (40, 3), (42, 5), (44, 9), (46, 14), (48, 28), (50, 32) and (52, 35)
X - axis - upper limits 1 cm = 2 units.
Y - axis - less than c.f. 1 cm = 4 units.
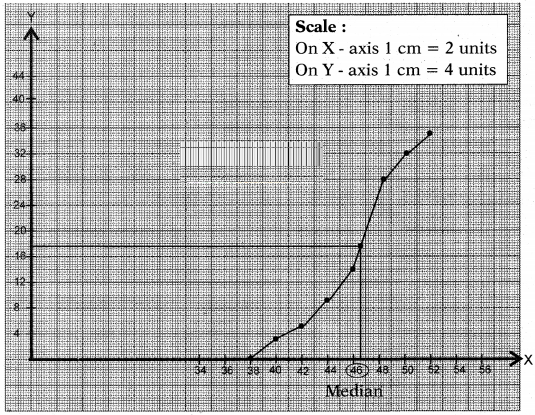
Number of observations = 35
∴ N/2 = 35/2 = 17.5
Locate the point on the ogive whose ordinate is 17.5.
The x - coordinate of this point is the required median.
From the graph, median = 46.5.
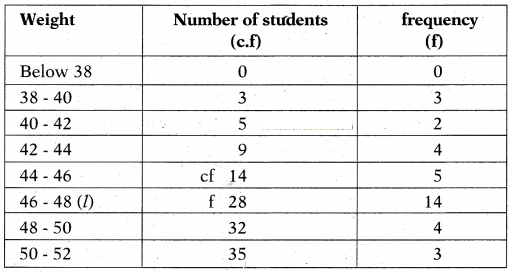
Number of observations = n = 35
∴ N2 = 352 = 17.5
17.5 belongs to the class 46 - 48
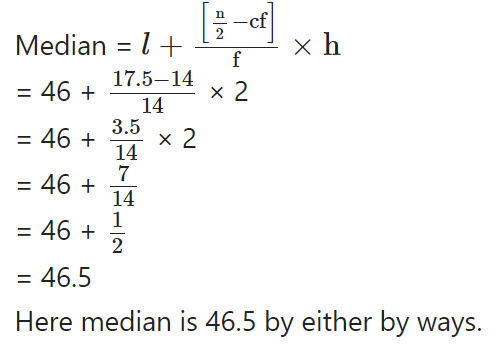
∴ Median class = 46-48
l - lower boundary of class = 46
f - frequency of the median class =14
c.f = 14
Class size = 2
Question 3.
The following table gives production yield per hectare of wheat of 100 farms of a village.
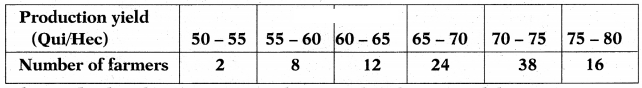
Change the distribution to a more than type distribution, and draw its ogive.
Answer:
The given data is to be changed to more than frequency distribution type.
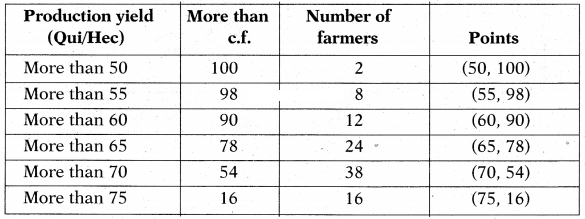
A graph is plotted by taking the lower limits on the X - axis and respective of Y - axis.
Scale:
X - axis: 1 cm = 5 units
Y - axis: 1 cm = 5 units
